After having developed the computer model, we performed several computer simulations to investigate the relationship between freezing rate, composition and ice crystal size. We zoomed into a small part of the food material and seeded several nuclei for ice crystals to grow. This part of food material was then subjected to a range of freezing rates. Simulations were performed for two different sucrose concentrations – and a multitude of different random positions of the nuclei – in order to obtain some good statistics.
Snapshots of these computer simulations are shown in Figure 1. The dark blue dispersed elements are individual ice crystals. The freezing rate is not very fast, so we can assume that the ice crystals remain approximately spherical. For understanding of the simulation results it is important to know that ice crystals do not contain sugar, so the growth of ice crystals implies the increase of sugar concentrations in the unfrozen phase. The increased sugar concentration leads to an increase of the freezing point, leaving the continuous matrix unfrozen.
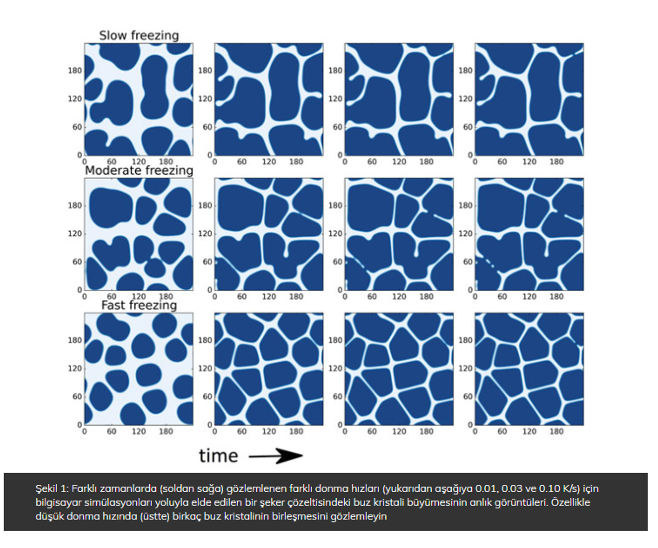 Upon further freezing the ice crystals can impinge on each other, prompting an enhancement of the sugar concentration in the unfrozen liquid in between them, leading to freezing point depression. Hence, a flat interface is developed. If the freezing rate is too slow, the sugars have time to diffuse out of the impingement zone and the crystals can coalesce. In the early stage of freezing, where the local increase of sugar concentration due to ice crystal growth is small, there are several coalescence events. In the later stage of freezing, the unfrozen matrix approaches the glassy state – where the diffusion of water and sugar grinds to a halt and ice crystal growth stops.
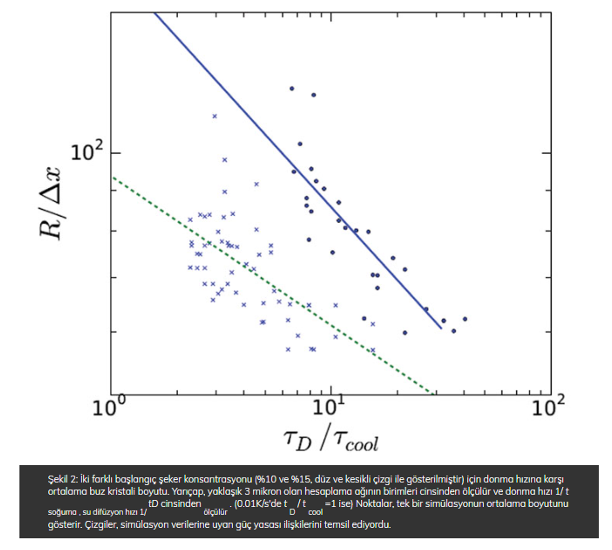
From the simulations we have determined the average ice crystal size and have plotted this against the imposed freezing rate for two different sucrose concentrations. These results are shown in Figure 2.
Considerable scatter can be observed in the simulation data, due to the stochastics of the nucleation process. However, by performing many simulation runs, one can fit a reliable power law relation through the data, which are displayed as the lines running through the data points in Figure 2 (page 00). The fitting shows that exponents of the power law are 0.31 and 0.18 for 10% and 15% initial sugar concentration, respectively. Our earlier empirical relationship has a power law exponent of 0.25, which was assumed to be composition independent. The fact that the empirical value is quite close to the exponents we have found via simulation is very encouraging. Furthermore, it is worth noting that the simulation model did not require any parameter fitting, as all material and thermodynamic properties are known.
Food Quality Issues For Frozen Fruits and Vegetables
Food & Biobased Research concludes that the model does have a large degree of realism. Moreover, similar predictive theories on material and thermodynamic properties are available for many other food materials. Consequently the model is, in principle, applicable to a multitude of other food materials. On this basis we have launched a new research project that continues to develop and adapt the model to frozen food materials with a cellular structure to investigate frozen food quality issues for fruits and vegetables. The phase field model will be embedded in a multiscale model – because in food products local differences in freezing rate will arise – which must be resolved with an advanced approach, where the temperature profile is computed at the product scale, and the ice crystal growth at the microscale. The macroscale computer model will call the microscale model multiple times for a multitude of locations. The microscale model will report back the local ice fraction, while the macroscale model will issue the applied temperature gradient to the microscale model.
In this new project, Food & Biobased Research, we will not only focus on the initial freezing step, but also on the frozen storage. During storage temperature fluctuations can occur due to the mechanical cooling, or door opening and closing. It is assumed that these temperature fluctuations allow ice crystals to grow further, which is disadvantageous for the product quality6. We aim to investigate whether lowering the storage temperature makes the food less sensitive to temperature fluctuations, and even whether reduction in energy usage can be obtained. Moreover, even where storage temperature is reasonably constant, there is still coarsening of ice crystal distribution occurring during storage at the conventional conditions of -18oC. This is shown in the comparison of food frozen via airblast freezing and Pressure Shift Freezing (PSF). Initially, the ice crystal size obtained via PSF is much smaller than obtained via convential airblast freezing. However, after several weeks of storage little difference in the final ice crystal size distribution is found, indicating that coarsening has happened during storage of PSF foods7.
In summary, the new simulation model is an essential tool to dive into possible means for the frozen foods industry to control frozen food texture and ice crystal size, in areas such as 1) product formulation, 2) processing conditions and freezing rate. Knowing the impact of formulation and processing on frozen food quality, novel strategies for frozen storage can be evaluated due to their impact on both product quality and energy savings.
References: https://www.newfoodmagazine.com/article/23904/refrigeration-impact-of-ice-crystal-size-and-freezing-rate/


